A common statistical method used in Six Sigma is regression analysis, which allows predictions to be made based on the presence of a linear relationship between two variables. This article explores how this is significant in Six Sigma and further explains the regression analysis process.
Formulating Predictions
The goal of Six Sigma is to improve the quality and productivity of a project team or company. In order to accomplish this goal, Six Sigma proponents use a variety of statistical methods to determine whether observed results were in alignment with what was expected, one of which is a Chi-Square test . Another similar statistical test often used in Six Sigma is a regression analysis, which allows predictions to be made from observed and expected values.
A regression analysis enables one to determine whether a relationship exists between two variables. This is highly useful because it means that a regression analysis can be used to determine whether one variable, an independent variable, can be used to predict another variable, a dependent variable. The stronger the relationship is between two variables, such as process modification and defective rates, the greater the accuracy in predicting the defective rates for a particular process modification.
Regression Analysis in Plain Language
Simply stated, regression analysis is a statistical method that determines the extent to which a relationship exists between two variables. If the relationship is strong enough, one can then accurately predict the values of one variable based on the values of another using a simple linear formula.
There are many different types of relationships that can be identified, such as a curvilinear, u-shaped, or exponential relationship. However, the more common relationship, and the relationship that enables one to easily predict the value of a dependent variable, is the straight-line linear relationship.
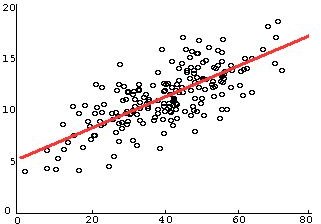
To determine whether a relationship exists between two variables, one must plot the values on a graph, in which the independent variable is on the X-axis and the dependent variable is on the Y-axis. Since the dependent variable is what one is hoping to predict, the simple linear formula is Y = bo + b1X, in which:
- Y is the value of the dependent variable
- b0 is the Y-intercept, which is the value of Y when X=0
- b1 is the slope, which is the change in Y per one unit change in X
- X is the value of the independent variable
Using a regression analysis, one can accurately identify the best-fit line to minimize the variance between the sample data values and the imposed line. Once the best-fit line can be identified, the variables on the right-hand side of the simple linear formula can be calculated, enabling one to accurately predict the value of Y.