One of the most commonly used hypothesis testing tools is a Chi-Square test. This article explains how to perform a Chi-Square test and what role a Chi-Square test plays in Six Sigma methodology.
Looking For Variance
The goal of Six Sigma is to improve the quality and productivity of a team or company. In order to systematically and objectively accomplish this, Six Sigma uses certain statistical methods to detect and control variation. This process is necessary to improve quality and reduce product deviation that could result in customer dissatisfaction.
One of the statistical tests used throughout Six Sigma is a Chi-Square test. A Chi-Square test is a hypothesis testing tool that determines whether there is a statistically significant difference, or variance, between two independent groups, wherein the difference does not exist simply due to chance.
The importance of a Chi-Square test in Six Sigma is readily apparent when a business or project manager is attempting to determine whether a process manipulation was successful at improving quality and/or reducing product variation. After the successful implementation of a process manipulation, data can be gathered to represent a sample group. A Chi-Square test is then conducted to determine whether the results for the sample group are statistically different than what was expected compared to the baseline data, which determines whether the implementation was successful due to process improvements or to chance.
Steps to Complete a Chi-Square Test
The following steps identify how to compute a Chi-Square value and determine whether that value is statistically significant. See this How to Perform a Chi-Square Test document for a detailed walk-through of the steps listed below.
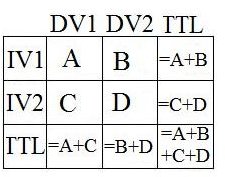
Organize the collected sample data by putting the values in a two-way table. The table’s rows represent the independent variable, and the table’s columns represent the dependent variable.
Calculate the total frequencies for each row and column by adding up the cell totals from step one.
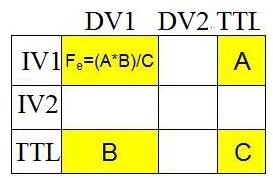
AdvertisementCalculate the expected frequencies for each cell by multiplying the cell’s row total by the cell’s column total and dividing that number by the overall total.
 Advertisement
Calculate the Chi-Square value. First, calculate the squared difference between a cell’s observed and expected frequencies and then divide that number by the cell’s expected frequency. After calculating that first number for all cells, add up each value to determine the Chi-Square value for the sample data.
Consult the Chi-Square distribution table to determine if the value is statistically significant. The goal is to have a p-value that is less than 0.05, which means there is less than a 5 percent chance that the results could have been produced by chance.
Advertisement