This article will simplify the concept of Taguchi loss function and explain the method of Taguchi loss function with a practical example.
Broadly, the Taguchi loss function explains that until a component is manufactured in the nominal size, it incurred a certain amount of loss to the manufacturer even though it has been manufactured within specified tolerance limit. The loss incurred by the component is zero in its nominal size and gradually increase as it deviates from the nominal size.
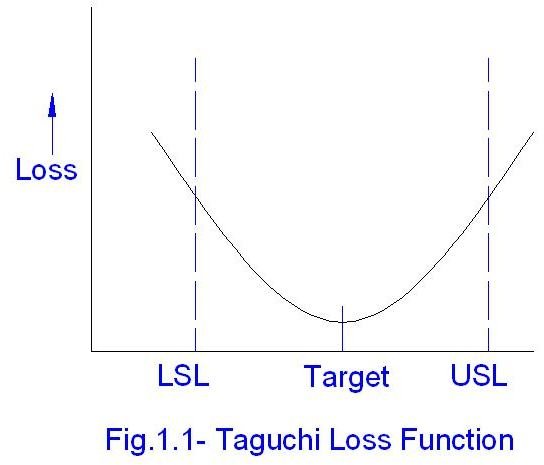
Graphical Representations and Interpretations of the Taguchi Loss Function
The parabolic curve shown above represents the Taguchi loss function. From the curve you can interpret that the amount of loss is minimum for the target (or nominal value of a part) and as you deviate from the target the amount of loss increases even if you are within the specified limits of the process.
Mathematical model of the Taguchi Loss Function and Its Explanation
The parabolic curve of the Taguchi loss function can be represented as below:
Loss at any point L(x) = C*(x-t) ^2…………….Eqn. 1.1
Where,
C = Coefficient of Taguchi loss
x = A point on the curve
t = Target Value (Nominal value)
Average Taguchi loss per item for a sample set:
L= C*(d^2+ (m –t) ^2)………………Eqn.1.2
Where,
m = Process mean
t = Target Value (Nominal value)
Practical Example of Taguchi Loss Function
A shaft designer and manufacturer has manufactured a lot of 30 shafts. USL, LSL and nominal diameter of the shaft should be 0.55 mm, 0.45mm and 0.5mm respectively. Diameters of all the 30 shafts are as below:
0.469 0.488 0.496 0.511 0.521 0.537
0.463 0.484 0.496 0.502 0.517 0.533
0.468 0.499 0.496 0.512 0.522 0.533
0.475 0.492 0.499 0.515 0.534 0.534
0.477 0.493 0.51 0.519 0.537 0.546
Cost of rework for a shaft with diameter 0.511 is $0.5.
You have to find out the total loss occurred for the whole set of 30 shafts.
Solution:
For the above set of data,
Mean, m = 0.505
Standard deviation, d = 0.0231
Target, t = 0.5
L(x) =$0.03 when, x=0.501
Now, using the Eqn.1.1, we can find out,
Taguchi loss coefficient for the process, C = 0.03/ (0.511- 0.5) ^2 = 247.9339
Now, using Eqn.1.2, we can find out the average loss for each part of the whole set (30 numbers) as:
L = $0.13
So, Total loss for all the 30 shafts = 30*0.13 = $4.15
Conclusion
The method of Taguchi loss function quantifies the amount of loss incurred by a product. Taguchi function is a six sigma tool. As per the Taguchi loss function, the amount of losses increases with the deviation from the target.