What are control charts and why are they needed? Often in Lean, Six Sigma, and Agile, they will let you know if an element within your project is out of control. Here, Jean Scheid gives us a typical example of a control chart and how they’re utilized.
A Brief History
Walter Shewhart first utilized control charts in 1924 to aid the world of manufacturing. When total quality management (TQM) was explored, W. Edwards Deming added elements to control charts to assess every area of a process or organization.
According to SCQ Online , Walter Shewhart’s thought was that, “no matter how well the process is designed, there exists a certain amount of nature variability in output measurements.”
There are two types of control charts ; those that analyze attributes and those that look at variables in a process or project. Examples of a control chart include:
- X-Bar & R Control Charts
- X-Bar & S Control Charts
- U Charts
- P Control Charts
- C Control Charts
Every project that insists on regulation, risk analysis, and quality management needs to have control charts to truly discover if a project is indeed out of control or if the variables and attributes are acceptable.
Purpose

KnowWare, the maker of QI Macros SPC Excel Software for Six Sigma, says of control charts, “A control chart tells you how much variation the process causes. A stable process produces predictable results consistently.” An example of a control chart that shows an unstable process means variables affected must be analyzed and controlled before the improvement process can begin.
Most examples of a control chart considers two causes of fluctuation, common causes and special causes. We could take baking a cake as an example of a common cause in a control chart. Even though a recipe is followed to the letter, elements considered common causes might be types of oven utilized or high elevation cooking—those items would be considered a common mishap if the cake baking process failed. Essentially, if you don’t know the exact temperature of an older oven or high elevation directions are not offered, it’s acceptable.
Special causes in baking that same cake might be a recipe that forgets the baking powder as a needed ingredient. The lack of baking powder is a special cause as it “causes” the cake baking process to fail. Therefore, why the cake baking process failed must first be discovered (lack of baking powder) and then corrected.
Examples of Control Charts
The most typical examples of a control charts include the following; click on the links to download samples.
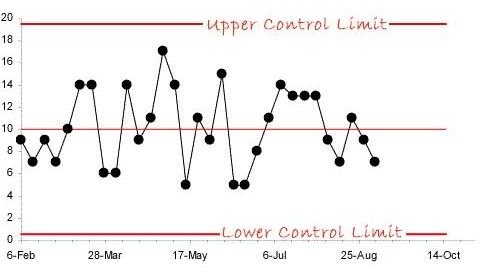
U Charts – These variable types of control charts utilize an upper and lower range. Elements falling in the upper range need attention and analysis in order for the problem to be corrected.
AdvertisementX-Bar & R Charts – These variable charts utilize the X-Bar or the Mean to determine subgroups. The R or Range plots the subgroups based on upper and lower control limits. X-Bar & R Charts are the most widely utilized charts in project management, however, are only successful if 5 or less subgroups are analyzed.
X-Bar & S Charts – Using this example of a variable control chart is effective for 5 or more subgroups and the S or Standard Deviations are considered in both upper and lower control limits based on the X-Bar or Mean.
Advertisementp Control Charts – This attribute-type chart is effective when elements are not equal. A p Control Chart might be used to determine how many accidents occur each day at a chosen intersection.
c Control Charts – Another attribute-type control chart, the c Control Chart explores elements that are nonconforming. A c Control Chart might be used to explore mass-production of one similar product where the elements per unit do not conform to the norm.
Advertisement
When considering each example of a control chart, match the project to the correct chart to help your projects succeed by determining unacceptable elements and correcting them before continuing to project stages needed for completion.